
How We Use Force Plates to Monitor Readiness and Adaptation in Football.
- Ralph King
- Mar 2
- 6 min read

Sports science has become a buzzword in Strength & Conditioning. Force plates, GPS, readiness scores, and dashboards are commonplace across college athletics. But just because you have access to technology doesn’t mean it’s being used effectively. The value in sports science isn’t in the data. It’s in how it is collected, interpreted, and applied to training and athlete development. Like any other tool, sports science doesn’t determine everything, it just supports decisions. Within our training we use force plates to answer two critical questions: Are our athletes adapting to training, and are they ready to perform week after week? Everything we do with that data is built around those answers, not chasing perfect numbers or overreacting to singular data points.
Why Do We Use Force Plates?
In our program, force plate testing using VALD ForceDecks is a key component of our overall testing protocol. I’m responsible for the force plate data collection, metric selection, and interpretation for our football team, and I created and manage a weekly dashboard that organizes this data for our Head Strength & Conditioning Coach to support training discussions and decision-making.
Force plates play such a significant part in our testing because they provide objective, repeatable data in a consistent environment. We implemented the force plates prior to Fall camp, making this our first season using them within the program. With that in mind, a testing schedule was created to ensure a seamless fit into our training sessions while allowing us to monitor readiness and training adaptation through the entirety of the season.
The goal with the force plates and dashboard was never to create the most complex or visually impressive monitoring system. The objective was to build the most efficient and practical athlete monitoring system that supports coaching decisions and provides an objective view of how the athletes are responding to training.
What Are We Really Trying to Answer?
Before deciding what to test or which metrics to look at, we were clear what we wanted the force plates to tell us. Everything we do with the force plates revolves around two questions:
Are athletes adapting to training over time?
Are our athletes ready to compete at their highest level this week?
Having those questions provides us with a clear framework when it comes to testing and interpretation.
Tracking adaptations allows us to evaluate if our athletes are continuing to improve throughout the season or becoming stagnant. Rather than focusing on isolated tests or singular data points, the main focus is on long-term trends and how they align with the changes in volume, intensity, workload on the field, etc.
On the other hand, readiness provides us with weekly context. Force plate data allows us to determine if the athletes are responding to the training stimulus or if they have accumulated too much stress, fatigue, or outside factors that are affecting their performance. Readiness is not treated like a pass/fail system. It is more of a sliding scale or stoplight system. As part of this process, I am developing a system that flags athletes who may warrant a deeper dive into their testing trends.
These questions do more than just make us evaluate the tests on a weekly basis. They also helped me decide which metrics to look at. If a metric does not help us understand readiness or adaptation, then it does not earn a spot on the weekly report. This keeps the system repeatable, focused, and aligned with our objectives.
Why Do Different Sports Benefit From Different Metrics?
Force plate testing remains consistent, no matter the sport being tested. What changes is which metrics are emphasized and how the data is interpreted, based on the demands of the sport and the needs of the athlete. The movement may stay the same, but the questions being asked can change, and with that the metrics being used for evaluation may shift.
The emphasis and questions being asked can differ based on the time of year as well. Early in the year, additional metrics may be added to evaluate how an athlete is responding to new or increased stress. During the early phases, a longer look may be taken to evaluate the movement tendencies of the athlete. As the season closes in, the scope narrows, and the focus is only on a shorter list of metrics. That can help us answer those questions at a glance.
In football, our main questions are: Are the athletes adapting to our training and are they ready to perform through the season. Given the nature of the sport and how physical the game is, a greater emphasis is placed on how outputs trend over the course of a long, demanding season. The force plate itself does not determine which metrics matter most. The sport, training phase, and questions being asked determine that.
By allowing metrics to evolve based on the time of year and sport demands, we keep the force plates aligned with the training objectives. The tool stays the same, but the objectives of testing may change.
What We Test and Why We Keep It Simple?
While force plates provide many outputs, we intentionally limit the metrics we emphasize to a small set that consistently help answer our two primary questions: are athletes adapting to training, and are they ready to perform?
Output Metrics:
Jump Height
Mean Concentric Power
These metrics provide a clear picture of an athlete’s ability to express force and power. We used to use Relative Mean Concentric Power, but that has changed. As the competitive season approaches, these outputs become increasingly important because they help answer the most practical question we face week to week: can the athlete perform at a high level on game day?
Strategy Metrics:
Contraction Time
mRSI
These metrics help us understand how force is being produced and whether changes in output reflect meaningful adaptations or shifts in movement strategy. In these phases, performance is not judged solely by how high or how powerful an athlete jumps, but by how that force is generated.
Hop Test Metrics:
Mean Jump Height
Mean RSI (Jump Height/Contact Time)
These measures help contextualize an athlete’s ability to rapidly express force rather than simply produce a single max effort jump.
These metrics aren’t looked at in isolation. Their value comes from how they trend over time, how they align with training load, and how their emphasis changes based on the phase of the year. Metrics are only kept in the system if they consistently support interpretation of readiness or adaptation.
How We Use and Organize The Data
Force plate data is interpreted relative to the historical trends of the athlete, position group, and team as a whole. A decision is not driven by a singular training session or test. The data is always interpreted alongside what is seen in the weight room or on the field.
We look for consistent changes or trends to guide decision-making. When those changes or trends arise, a conversation can be prompted: Why is this happening? Is there an increase in training load? Are they not recovering properly?
To help manage this process across the entire roster, the data is compiled into a weekly dashboard. The dashboard allows us to track key metrics over time, identify any athletes who may need a closer look, and answer both of our questions: How are the athletes adapting to training? Are they ready to perform on gameday?
The goal is not to chase perfect numbers. It is always to collect data and interpret how the athlete is responding to training, sport, and life stressors.

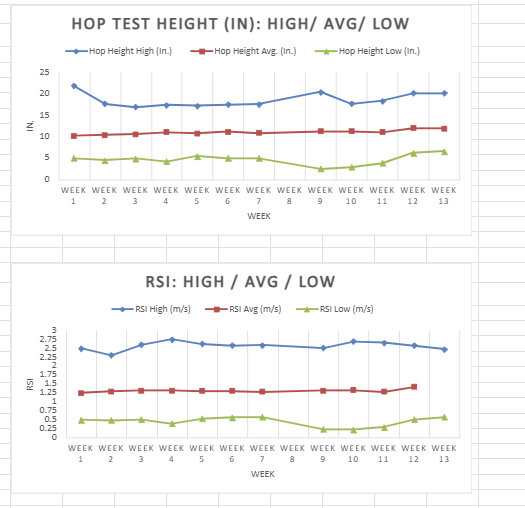
The images do not show the entire dashboard, but they provide a good idea of how easily the data can be interpreted. The dashboard itself is not the decision maker. It simply organizes the information in a way that makes conversations more efficient and the data easily understandable.
Final Thoughts
Force plates have become an important addition to our athlete monitoring system. When used with a clear and intentional purpose, they can provide insight into how athletes respond to training. At the same time, sports science does not determine everything. Just like anything else when it comes to training, it is a tool in our toolbox. Coaches' eye, athlete feedback, and demands of the sport play huge roles in the decisions being made. The goal of this technology is to provide us with consistent and observable data that can assist in our athlete monitoring system. Looking at the dashboard you can see it is not the most complex in the world, it isn’t supposed to be. Our goal is to create a system that supports athletes, coaches, and the training process throughout the season.
When we use the force plates they do exactly what they should: support coaching rather than replace it.


Comments